
FIGURE 4.
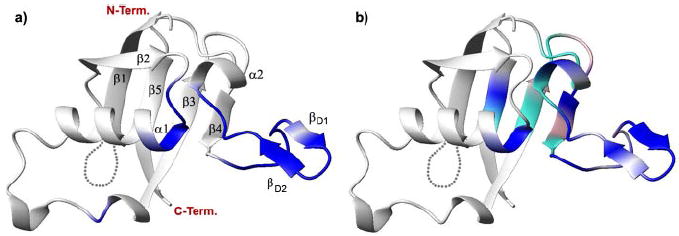
a, significant resonance intensity changes (scaled Ihigh/Ilow < 0.2, blue) upon RBD dimerization (28) mapped onto the structure of the RBD x-ray structure (Protein Data Bank code 2r2o). b, location of residues that experience significant saturation transfer (Isat/Iref < 0.7, blue) or only chemical shift perturbations (weighted Δδ > 0.15 ppm, cyan) as a result of GTPase-plexin RBD interactions mapped onto the structure of the Rho GTPase binding domain of plexin-B1. Locations with missing data are colored in pink. The secondary structure of the protein is shown in ribbon presentation. Loop residues 1757–1763 are missing in the crystal structure and are indicated by dots.