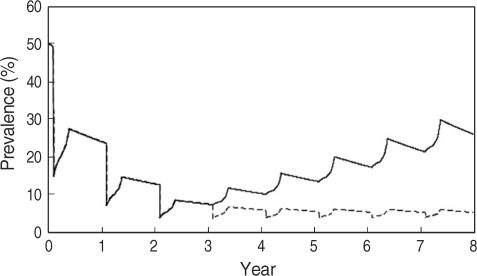
Fig. 5.
Variations in the prevalence in humans with 2 control measures. 1: Yearly universal treatment (UT) with a 70% coverage rate for the initial 3 years (solid line), 2: After 3 years of annual UT targeted mass treatment (TT) with a 85% coverage rate (dashed line) [14].

