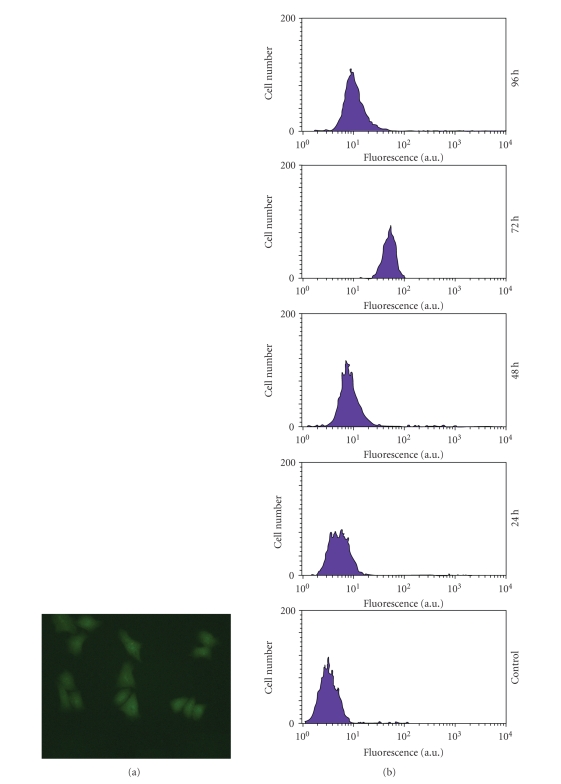
Figure 9.
(a) Qualitative evaluation of EGFP-N1 transgene expression in HepG2 cells with chitosan-coated PBCA-NPs, fluorescent image (×200) of the cells was obtained after 96 hours upon incubation. (b) Quantitative evaluation of EGFP-N1 transgene expression in HepG2 cells as a function of time measured by flow cytometric analysis with chitosan-coated PBCA-NPs. HepG2 cells without any treatment were used as control.

