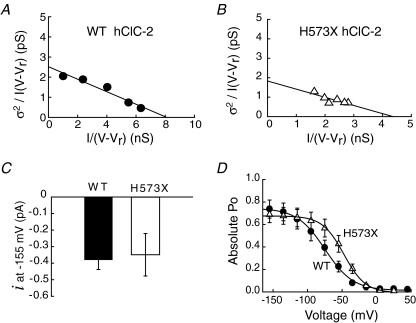
Figure 3. Stationary noise analysis of WT and H573X hClC-2.
A and B, plots of the variance, normalized by the product of the mean current (I) and the electrical driving force (V–Vr), versus the macroscopic conductance I/(V−Vr) from representative cells expressing WT (A) or H573X (B) hClC-2. C, unitary currents (i) at −155 mV of WT (n = 6) and H573X (n = 4). D, voltage dependence of the absolute open probabilities of WT (n = 6) and H573X (n = 4) channels. Fits to linear (A and B) or Boltzmann (D) functions are shown as lines.

