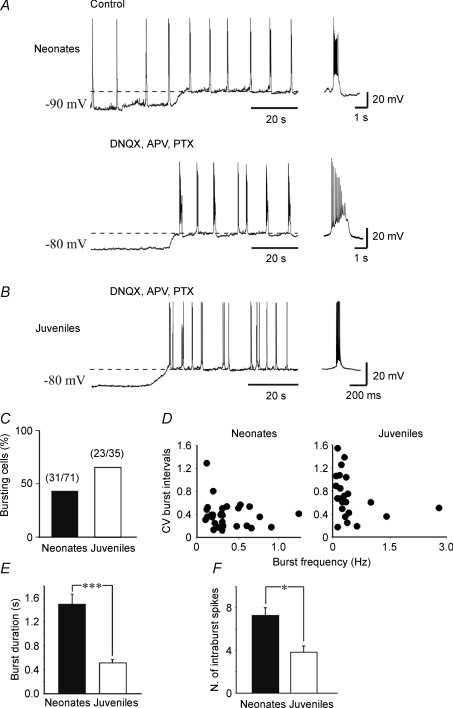
Figure 6. Intrinsic bursting activity in neonatal and juvenile neurons.
A, upper trace, GDPs recorded from a CA3 pyramidal cell at P5. The frequency of GDPs did not change by depolarizing the membrane from −90 mV to −70 mV (dashed line) indicating that GDPs are network-driven events. Lower trace, same cell, after blocking synaptic activity and GDPs with DNQX (20 μm), APV (50 μm) and picrotoxin (100 μm). Depolarizing the membrane from −80 mV to −56 mV (dashed line) induced the appearance of intrinsic voltage-dependent bursts, different in shape from GDPs (see individual samples on the right). B, representative tracing from a P21 neuron. At this postnatal age, GDPs are not present any more. Depolarizing the membrane to −65 mV (dashed line) in the presence of DNQX, APV and picrotoxin revealed intrinsic bursts which differed in frequency and shape from those recorded in neonatal neurons (see individual burst on the right). C, incidence of intrinsic bursts in neonatal and in juvenile neurons. D, the coefficient of variation (CV) of interburst intervals plotted against burst frequency in neonatal (left) and in juvenile neurons (right). E and F, mean burst duration and number of intraburst spikes in neonatal (n = 26) and in juvenile neurons (n = 20). Note that in juvenile neurons burst duration was significantly shorter and the number of intraburst spikes was significantly smaller than in neonatal neurons. *P < 0.05; ***P < 0.001.

