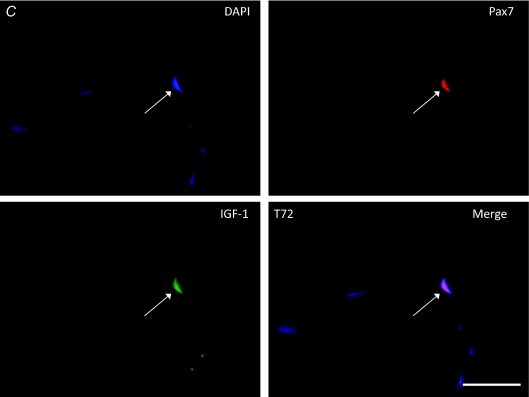
Figure 6.
Immunofluorescent staining of muscle cross-sections triple-stained for nuclei (DAPI), satellite cells (Pax7; TRITC), and IGF-1 protein expression (FITC) at T0 (A; scale bar = 20 μm, arrows denote Pax7+/DAPI+ satellite cells), T24 (B; scale bar = 20 μm), T72 (C; scale bar = 20 μm). For A–C, arrows denote satellite cells (Pax7+/DAPI+) (B and C) expressing IGF-1 protein. Note: no IGF-1 present at T0 (and T4, not shown) and diffuse IGF-1 staining in the myofibre at T72 and T120 (not shown).


