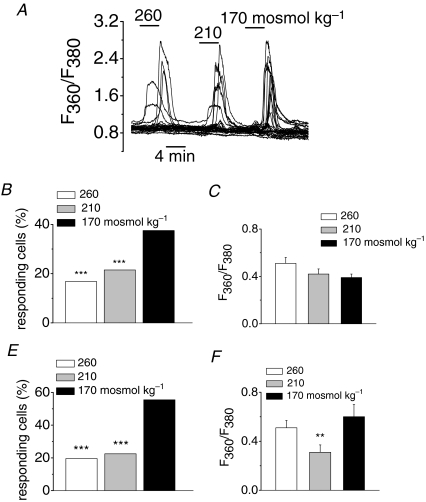
Figure 2. Osmolarity dependence of responsive cells in fura-2-loaded HEK293 cells expressing TRPC5.
A, [Ca2+]i changes in response to reduction in extracellular osmolarity from 300 mosmol kg−1 to the indicated values (for these set of experiments the fura-2 fluorescence was measured at its isosbestic point). B–F, bar graphs summarizing the percentage of responsive cells and the mean evoked [Ca2+]i elevation after consecutive steps in hypoosmolarity in the same cell (B and C; n = 576) and after application of one of the indicated solution (E and F; n = 271 for 260 mosmol kg−1, n = 187 for 210 mosmol kg−1 and n = 45 for 170 mosmol kg−1). **P < 0.01; ***P < 0.001; Z-test and one-way ANOVA. In B and E the asterisks denote statistical significance compared to maximal response obtained (170 mosmol kg−1). In C and F the comparison were made between the experimental conditions.

