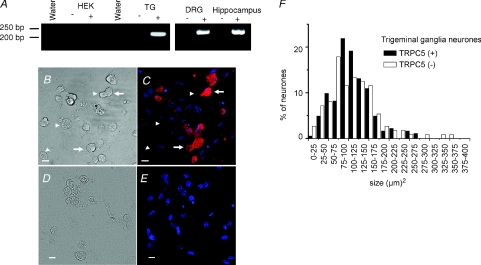
Figure 8. Expression of TRPC5 channels in primary sensory neurones.
A, RNA from trigeminal and dorsal root ganglia, hippocampus and HEK-293 cells was reverse transcribed (+) and PCR amplified with specific primers for murine and human TRPC5. The (–) symbols in the panels indicate the reactions for each RNA sample run in the absence of SuperScript II (see Methods). Water lines correspond to the PCR mix with water as a negative control for PCR amplification. B–E, immunocytochemical staining of TRPC5 in dissociated mouse TG neurones visible in transmitted (B) and confocal microscopy (C) and for the secondary antibody visible in transmitted (D) and confocal microscopy (E). Anti-TRPC5 immunoreactivity is indicated in red and Hoechst nuclear staining in blue. TRPC5-positive neurones are indicated by arrows and TRPC5-negative neurones by arrowheads. Scale bar 10 μm. F, bar graph of TG cell size distribution of TRPC5-immunoreactive cells.

