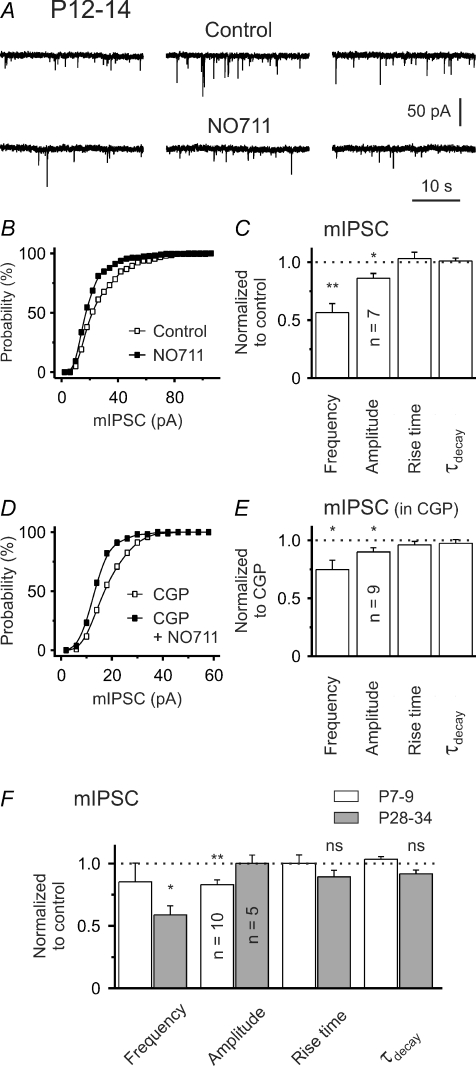
Figure 7. GAT-1 block reduces the median amplitude of mIPSCs.
A, sample traces at P12–14. B, NO-711 shifted the mIPSC amplitude distribution to the left. Data from same cell as in A. C, quantification of results for NO-711 effects. D, leftward shift of mIPSC amplitude distribution by NO-711 in the presence of CGP55845. E, quantification of results for NO-711 in the presence of CGP55845. F, summary of NO711 effects on mIPSCs at P7–9 and P28–34. ns – not significant, *P < 0.05, **P < 0.01.

