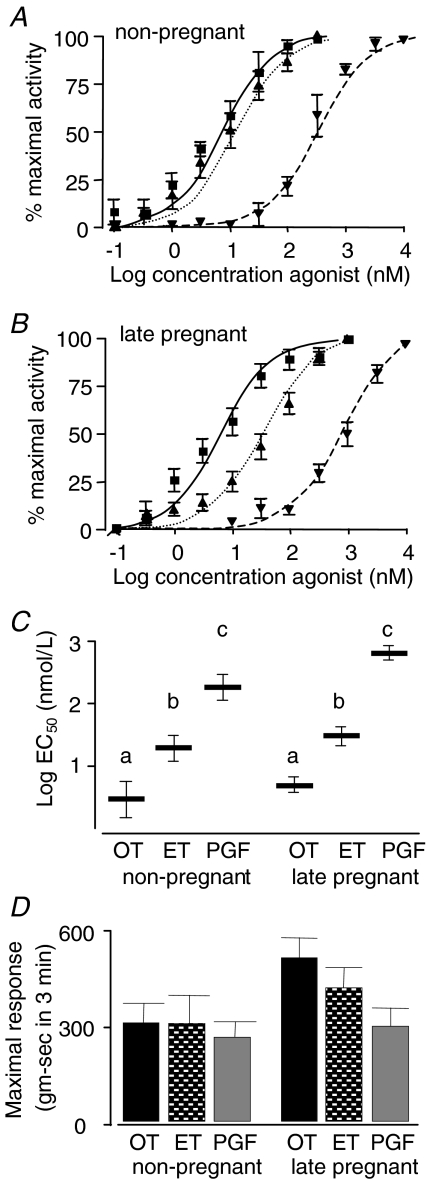
Figure 5. Myographic parameters of uterine contractility comparing the three uterine agonists oxytocin (OT), endothelin-1 (ET-1) and prostaglandin (PG) F2α.
A and B, the summary concentration–response curves in non-pregnant (n = 6, 5 and 6 for OT, ET-1 and PGF2α, respectively) and late pregnant (gestation day 18–21) animals (n = 19, 19 and 14 for OT, ET-1 and PGF2α, respectively) for OT (▪), ET-1 (▴) and PGF2α (▾). C, the log concentrations required to achieve half-maximal response (EC50) for agonist-induced contractions for rat uterine strips calculated from individual concentration–response curves for the same animals as in panels A and B. Because of the wide variation in EC50 among the different agonists, the data were log-transformed for statistical analyses and the transformed data are illustrated. Bars with unique superscripts are significantly different from bars without overlapping superscripts. D, the maximal responses (area under the curve for the concentration of agonist giving the maximal response) for the same animals. There were no significant differences among groups, though for the late pregnant animals the differences approached statistical significance (ANOVA, P = 0.0511).

