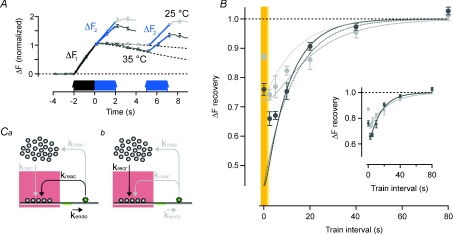
Figure 7. The recovery of a partially depleted RRP parallels the kinetics of endocytic retrieval of vesicles.
A, traces are average fluorescence at 25°C (light grey, n = 351 and 381) and 35°C (dark grey n = 390 and 388). A first train of 40 APs at 20 Hz (black arrows) was used to estimate the RRP size. This stimulation will also deplete it of releasable vesicles. The recovery of the RRP was probed by a second 40 AP train at various time intervals to the first (blue arrows), traces for intervals of 0 and 5 s are shown. Vesicle release was estimated from linear curve fits to the rising fluorescence trace during stimulation (ΔF). Hatched lines are projected decay of fluorescence used for correction when the rising phase of the second stimulation was superimposed on the decaying part of the first. B, graph showing the time course of recovery of the RRP. Light grey is at 25°C and dark grey at 35°C. Each data point from 145 to 390 synapses. Note that y-axis starts from 0.45. Continuous lines are from a model where the RRP recovers from a depleted state at t = 0 s (26% at 25°C and 44% at 35°C, predicted from the model in Fig. 6B). The recovery of the RRP was modelled either with the endocytic pathway being the only source of vesicles (Ca, continuous lines) or recruitment of reserve vesicles being the only source (Cb, dotted lines). Data points from an uninterrupted 80 AP train are highlighted on a yellow background. Inset shows single exponential curve fits to the same data, time constants are 23.1 s at 25°C and 15.3 s at 35°C, respectively. C, schematic illustrations of model conditions during intervals without APs with the RRP being replenished by endocytosis (a) or recruitment from the reserve pool (b).

