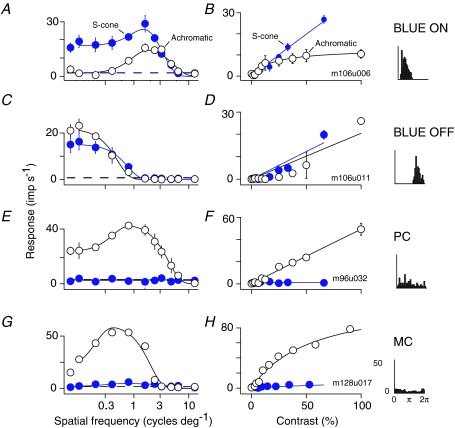
Figure 1. Spatial tuning and contrast sensitivity of different classes of LGN cell.
A, spatial frequency tuning of an example blue-on cell for drifting achromatic (open circles) and S-cone selective (filled circles) gratings. Smooth curves show fits of the difference-of-Gaussians model defined in Methods. Error bars show standard errors of the mean (some error bars are smaller than the data symbol). The dashed horizontal line shows the amplitude of the first harmonic in response to a uniform field at the same mean luminance and chromaticity as the gratings. The left-most data point, disconnected from the model fit, shows the response to a drifting grating at a spatial frequency of 0.01 cycle deg−1. B, contrast response function for drifting achromatic (open circles) and S-cone selective (filled circles) gratings, recorded from the same cell shown in A. Smooth curves show fits of the Naka–Rushton function described in Methods. For both colour directions the spatial frequency was that preferred for S-cone selective stimuli. The rightmost panel shows peri-stimulus time histogram, folded to one cycle of modulation, recorded during presentation of a drifting 0.01 cycle deg−1 S-cone selective grating. C and D, same as A and B for an example blue-off cell. E and F, same as A and B for an example parvocellular cell. In measuring the contrast response function for both colour directions we used the preferred achromatic spatial frequency. G and H, same as E and F for an example magnocellular cell.

