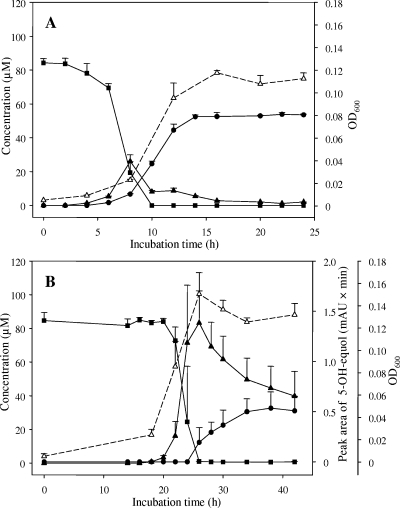
FIG. 1.
Time course of daidzein and genistein conversion by strain HE8. (A) Daidzein (▪) was transformed via dihydrodaidzein (▴) to equol (•). Cell growth is indicated by the optical density at 600 nm (OD600) (▵) (y axis on the right). (B) Genistein (▪) was transformed via dihydrogenistein (▴) to 5-hydroxy-equol (•). Values of 5-hydroxy-equol are expressed as peak areas (first y axis on the right). Cell growth is indicated by OD600 (▵) (second y axis on the right). The symbols indicate the means of triplicate experiments. The error bars indicate standard deviations.

