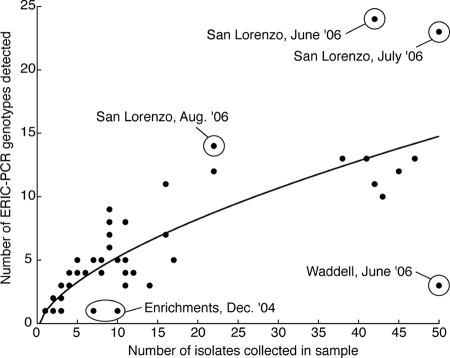
FIG. 1.
Relationship between sample size and ERIC-PCR genotype diversity. The number of ERIC-PCR genotypes detected in a sample increases according to a power law relationship with the total number of isolates collected (y = axb + c, where a is 1.48 ± 1.47, b is 0.60 ± 0.24, and c is −0.51 ± 1.97; r2 = 0.71). The power law model fit better than a linear model (r2 = 0.68) based on Fisher's F test (F = 9.49, P < 0.05). Samples discussed in the text are labeled for clarity.

