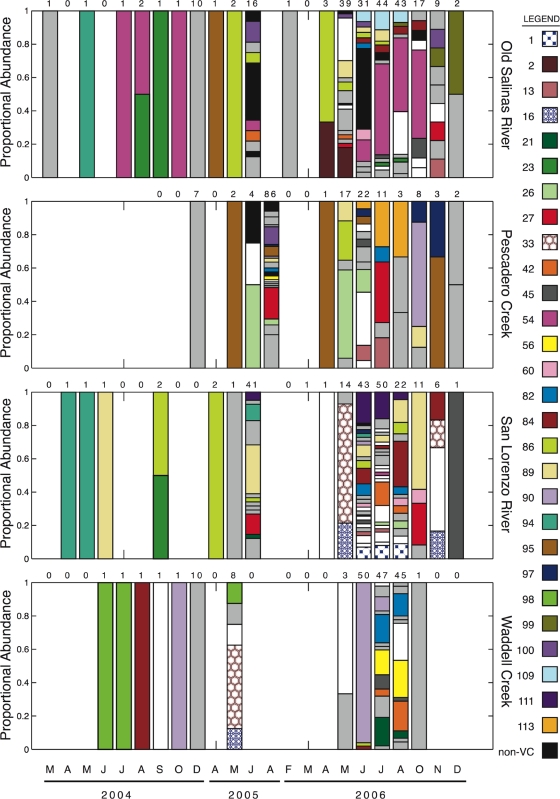
FIG. 2.
Proportions of selected genotypes collected from four sites over the entire sampling period. The numbers above the bars indicate the numbers of water column and sediment isolates collected and typed for the sampling event. The letters at the bottom indicate the months in which samples were collected. Each sample bar is divided into areas representing different genotypes (indicated by different colors and patterns) detected in the sample. To improve visual appearance, rare genotypes that appeared only once in the entire data set are indicated by white areas, while other genotypes that were not persistent in time or space are indicated by light gray areas. Genotypes classified as non-V. cholerae vibrios (non-VC) are indicated by black areas.

