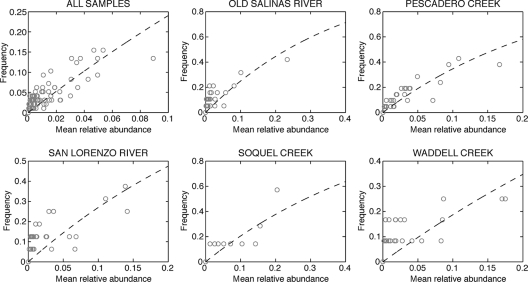
FIG. 3.
Fit of NCM to observed isolation frequency and mean relative abundance for ERIC-PCR genotypes from all environmental samples and from a subset of individual sampling sites. The open circles represent individual genotypes, and the dashed lines indicate the least-squares best fit. Fitting parameters are shown in Table 2.

