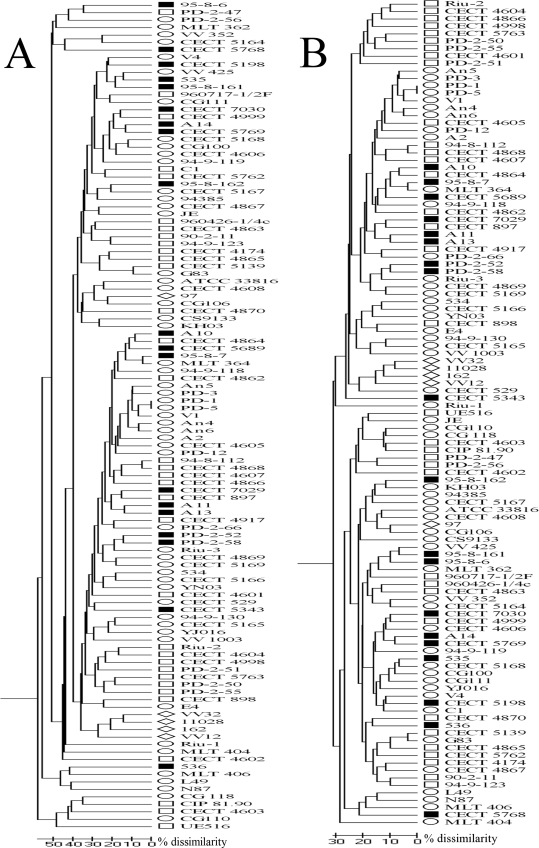
FIG. 1.
Dendrograms based on UPGMA analysis of the BIOLOG results obtained for the V. vulnificus collection using the Jaccard (A) or simple matching (B) similarity coefficient. The scale bars indicate the percentage of dissimilarity. Biotype 1 strains are indicated by open ellipses, biotype 2 serovar E strains are indicated by open rectangles, biotype 2 non-serovar E strains are indicated by filled rectangles, and biotype 3 strains are indicated by open diamonds.

