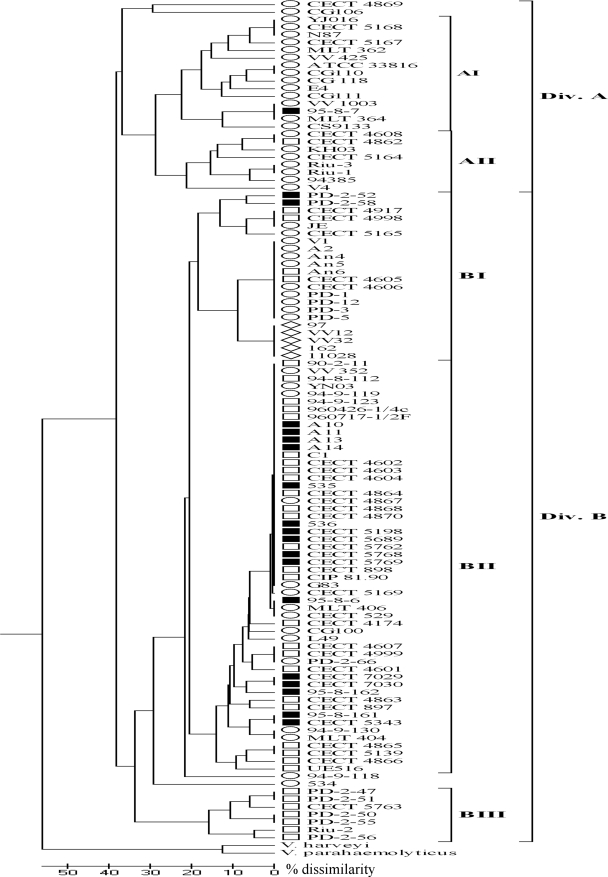
FIG. 2.
Dendrogram based on UPGMA cluster analysis of the ribotypes obtained in this study. The scale bar indicates the percentage of dissimilarity. Divisions A and B and the five ribogroups are shown. The symbols are the same as those used in Fig. 1.

