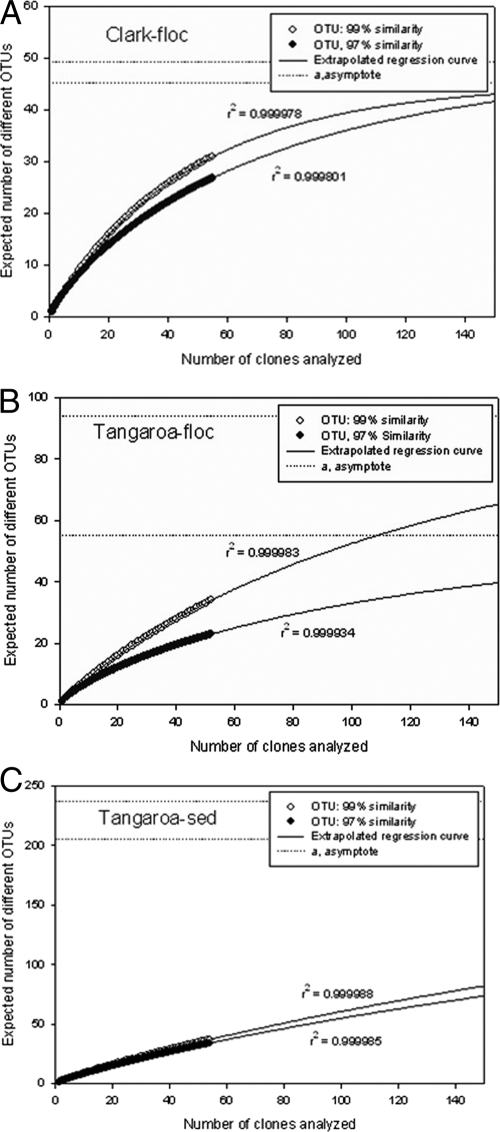
FIG. 4.
Rarefaction curves showing total diversity predicted from clone libraries. Open circles represent an OTU definition of 99% sequence similarity. Black circles represent an OTU definition of 97% sequence similarity. Dotted lines indicate the asymptotes of extrapolated regression curves (solid lines) and therefore the level of predicted total diversity. (A) Clark Fe-floc sample; (B) Tangaroa Fe-floc sample; (C) Tangaroa sediment sample.

