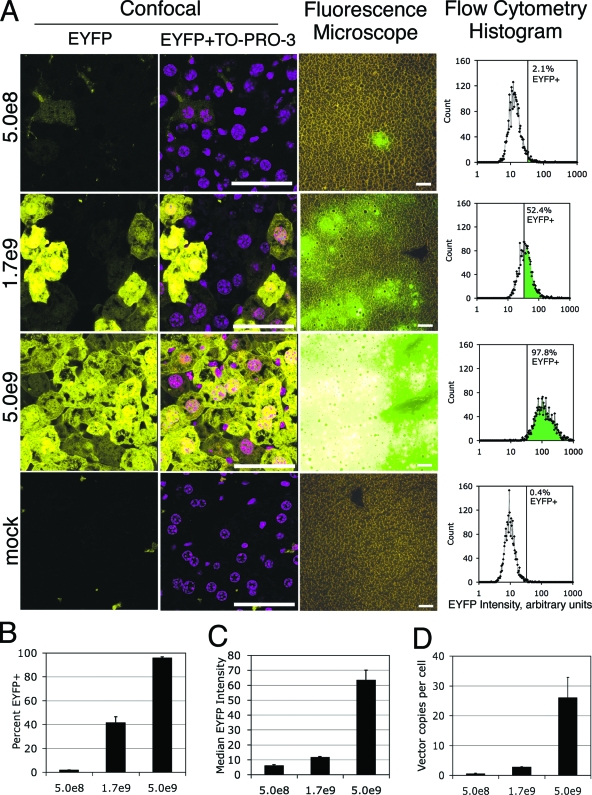
FIG. 2.
Efficiency of hepatocyte transduction in vivo. Adult, female nude mice were injected with HDAd-EBV.RL via the tail vein. Two mice at each of three different vector doses (5.0 × 10⁸, 1.7 × 10⁹, and 5.0 × 10⁹ IGU per mouse as indicated) and a mock-infected mouse were compared. At 6 days postinjection, the mice were sacrificed and liver tissue was harvested for the following analyses. Expression of the EYFP transgene from the vector was used to determine the efficiency of liver transduction. (A) Representative samples of liver tissue from each vector dose are presented. The first and second columns are laser scanning confocal micrographs of 50-μm-thick sections of fixed liver tissue. EYFP indicates vector-transduced cells. TO-PRO-3 was used as a nuclear stain. The third column contains micrographs taken from an epifluorescence- light microscope of 5-μm-thick unfixed sections. Signal intensity was adjusted for image quality in the confocal micrographs but is consistent across all of the fluorescent micrographs. Size bar equals 50 μm in all micrographs. The fourth column displays histograms of EYFP intensity quantified by analytical flow cytometry of single cell suspensions of liver tissue. The vertical line indicates the positive/negative threshold of EYFP as determined by the mock control samples. (B) Aggregate data from the flow cytometry analysis is presented. Each bar represents the mean percentage of EYFP-positive cells at each dose from replicate samplings (n = 3). (C) Additional aggregate cytometry data from the samples described above demonstrate the median signal intensity of EYFP-positive cells as determined from the cytometry histograms. Each bar represents the mean of replicate samplings (n = 3). (D) The number of vector genomes per diploid cell was quantified by qPCR. Each bar represents the mean of replicate samplings (n = 5). Error bars indicate mean ± the SEM.

