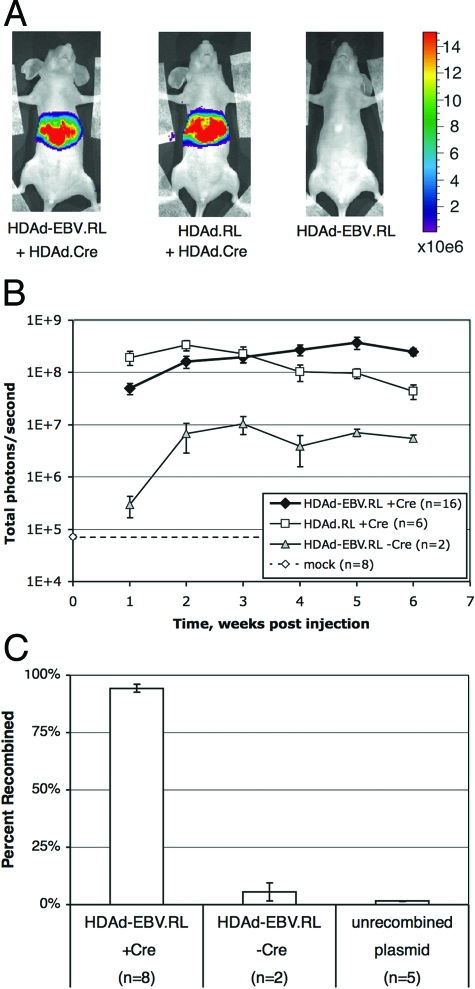
FIG. 3.
EBV episome delivery by HDAd-EBV vectors. Adult, female nude mice were injected intravenously with HDAd vectors and assayed for RL expression by bioluminescent imaging. Four cohorts were compared. Group 1 received 5 × 10⁹ IGU of HDAd-EBV.RL and 5 × 10⁹ IGU of HDAd.Cre (n = 16). Group 2 received 5 × 10⁹ IGU of HDAd.RL and 5 × 10⁹ IGU of HDAd.Cre (n = 6). Group 3 received 1010 IGU of HDAd-EBV.RL (n = 2). To determine the background of the assay, a fourth “mock” group was imaged using the same conditions as the experimental groups but received no vector (n = 8). (A) Representative images from the first three groups at 1 week postinfection. The total number of photons per second, as averaged over a 5-min bioluminescent exposure, was overlaid on an optical image of the mouse. The signal intensity was color coded according to the included scale from 1.5 × 10⁵ to 1.5 × 10⁷ total photons/s. (B) Mice were imaged weekly over a 6-week period after vector injection as in panel A. The number of photons/second detected in the region of the liver was plotted for each cohort over time. The dashed line indicates the background of the assay as determined by the mock cohort. Error bars indicate the mean ± the SEM. (C) Total DNA was prepared from samples of transduced liver tissue for analysis of recombination at the loxP sites by qPCR. Samples ranged from 9 to 30 weeks postinjection. A total of 10 mice injected with HDAd-EBV.RL were analyzed. Eight received HDAd.Cre, and two received no Cre. Each result is presented as a percentage of recombined vector relative to the total. A plasmid with only the unrecombined sequence was used to determine the background of the assay. Error bars indicate the mean ± the SEM.

