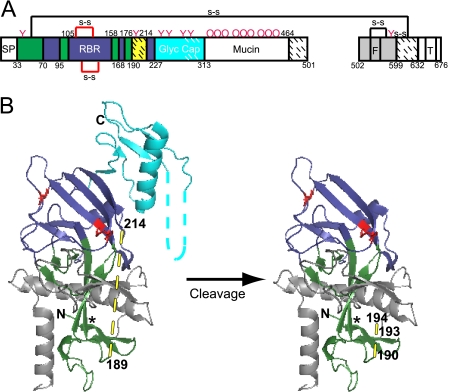
FIG. 2.
Model of primed 19-kDa ZEBOV GP1,2. (A) Domain architecture of EBOV GP1,2 (based on nomenclature and color coding in reference 14). The GP1 signal peptide (SP) (white; residues 1 to 32); base (green; residues 33 to 70, 96 to 105, 159 to 168, and 177 to 189), head (dark blue; residues 71 to 95, 106 to 158, 169 to 176, and 215 to 227), linker region (site of cathepsin B/L and thermolysin cleavage) (hatched yellow; residues 190 to 213), glycan cap (cyan; residues 228 to 313), mucin-like domain (white; residues 314 to 464), and C-terminal domain (hatched white; residues 465 to 501) are shown. The GP2 fusion peptide (F) and transmembrane domain (T) are labeled. Domains not present in the protein used for crystallography (14) are shown in white, and regions present but unresolved in the crystal structure are shown with hatches. Pink Ys and pink Os represent sites of N- and O-glycosylation. (B) Native structure of GP1,2Δ (left) and model of primed 19-kDa GP1,2 (right), based on Fig. 2 of reference 14 and colored as in panel A. Cysteine residues involved in disulfide bonds are in red, and predicted loop regions are shown with dashed lines. The asterisk (*) represents a contact point between the β1 and β13 strands (see the text for more details). Potential cathepsin B and cathepsin L cleavage sites (residues 190, 193, and 194) are labeled in the model (right). The graphic representations are based on PDB file 3CSY (14) and were produced with Pymol. Note that the depiction of primed GP1,2 in panel B (right) and in Fig. 7A, C, and D is strictly a model that assumes no conformational changes following proteolytic priming.

