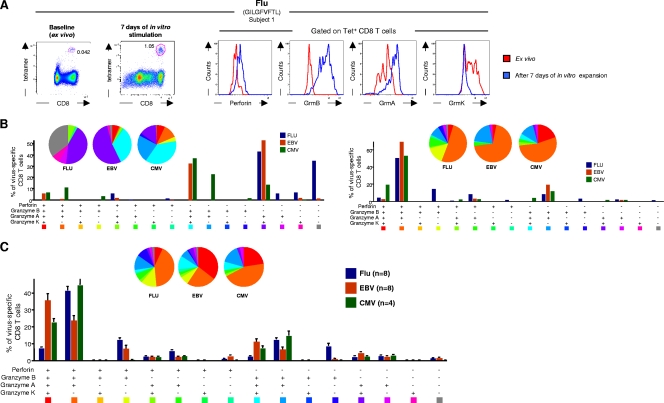
FIG. 3.
Relationship between the profiles of cytotoxic granules and Ag exposure in vitro.(A) Representative flow cytometry profiles of the expression of perforin, GrmB, GrmA, and GrmK on tetramer+ CD8 T cells from subject no. 1 directly ex vivo (red histograms) or after 7 days of in vitro expansion (blue histograms). Flu, influenza virus specificity. (B) Analysis of the simultaneous expression of GrmA, -B, -K, and perforin in influenza virus-, EBV-, or CMV-specific CD8 T cells from subject no. 1 directly ex vivo (left panel) or after 7 days of in vitro stimulation (right panel). (C) Cumulative data on the simultaneous expression of perforin and GrmB, -A, and -K in virus-specific CD8 T cells after 7 days of in vitro stimulation. All the possible combinations of the different markers are shown on the x axis, whereas the percentages of perforin/granzyme distinct cell populations within virus-specific CD8 T cells are shown on the y axis. The pie charts summarize the data, and each slice corresponds to the proportion of virus-specific CD8 T cells positive for a certain combination of perforin/granzymes.

