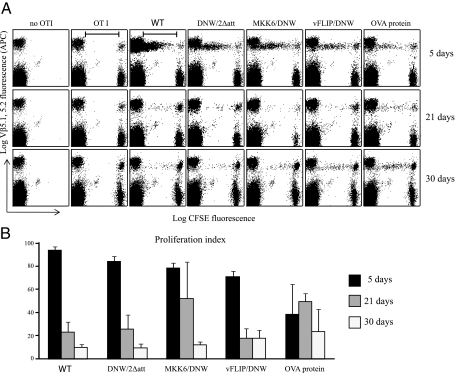
FIG. 2.
Persistence of antigen presentation. (A) OT1 cell proliferation induced by immunization with lentiviral vectors expressing IiOVA. Dot plot graphs show events gated on live cells and Vα 2.1 staining. Vβ5.1,5.2 fluorescence levels (y axis) are represented as a function of APC fluorescence. The top panel represents cell proliferation 5 days after vaccination, the middle panel 21 days, and the lower panel 30 days. The left column represents a group of mice that had no OT1 cells transferred and the next column a group of mice that had 2 × 10⁶ CFSE-stained OT1 cells transferred but were not vaccinated. Five more groups follow, all of which underwent adoptive transfer after subcutaneous immunization with vectors/controls (the wild type [WT], DNW/2Δatt, MKK6/DNW, vFLIP/DNW, and 100 μg of OVA protein in complete Freund's adjuvant). (B) The proliferation index was calculated by dividing the number of cells that proliferated from the initial population of CFSE/Vβ5.1,5.2-positive cells (marked with a bar) divided by the total number of CFSE/Vβ5.1,5.2-positive cells. Different immunization groups are depicted on the x axis, and the proliferation index is marked on the y axis.

