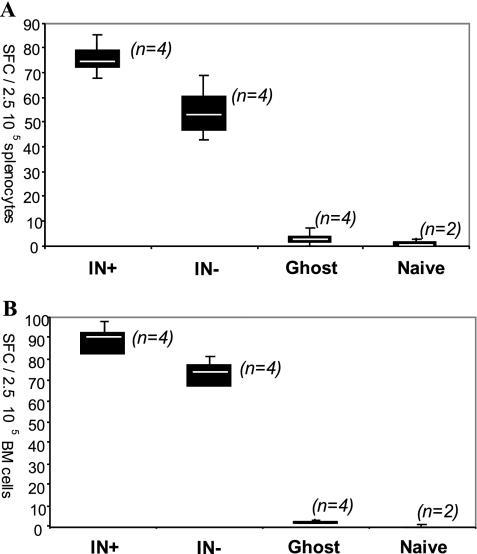
FIG. 7.
T-cell responses measured for cells isolated 2 months after immunization with lentiviral vectors expressing HBsAg. An IFN-γ ELISPOT assay was performed with splenocytes (A) and bone marrow cells (B) stimulated for 48 h with HBsAg. IFN-γ-producing T cells are expressed as numbers of spot-forming cells (SFCs) per 250,000 cells after background subtraction. The median for each data set is indicated by the white center line of the box plots. n denotes the number of mice used in each set. IN+, integration-competent virus; IN−, integration-deficient virus.

