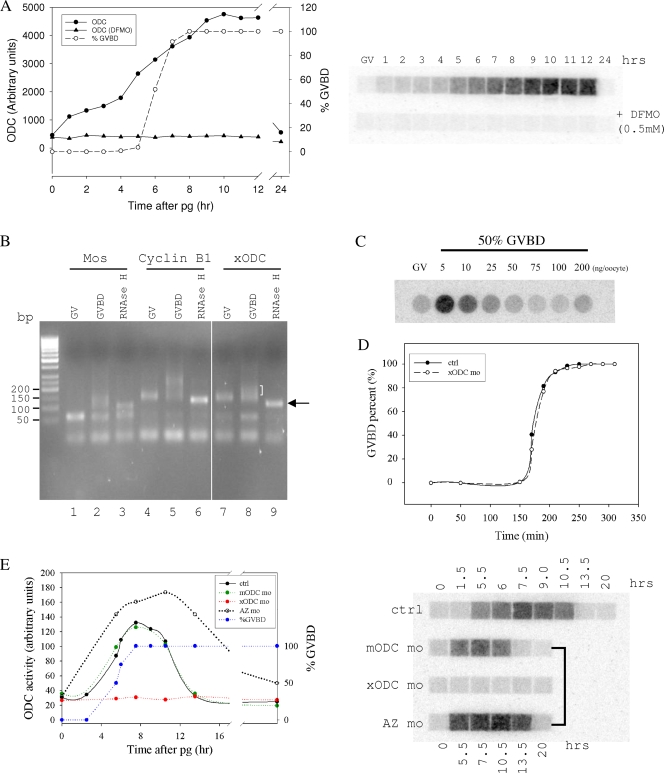
FIG. 1.
ODC exhibited translation-mediated transient activity increase during oocyte maturation. (A) Oocytes were treated with progesterone. At the indicated times, oocytes were examined for GVBD (expressed as percentages) and 10 oocytes were withdrawn and lysed for ODC activity assays. Each sample was split and assayed in the absence (upper row) or the presence (lower row) of 0.5 mM difluoromethylornithine (DFMO). (B) Total RNA isolated from GV oocytes (lanes 1, 4, and 7) or GVBD oocytes (2 h after 100% of the oocytes reached GVBD; lanes 2, 3, 5, 6, 8, and 9) were analyzed by ligation-coupled RT-PCR. The RNA samples in lanes 3, 6, and 9 were first treated with oligo(dT) and RNase H to digest the poly(A) tail before being subjected to the ligation-coupled RT-PCR analyses. This experiment showed that ODC mRNA in GV oocytes had a short poly(A) tail (compared to the “tailless” mRNA in lane 9, indicated by an arrow), which was extended (polyadenylated) in GVBD oocytes (indicated by a half bracket). (C) Oocytes were injected with the indicated amounts of xODC mo and treated with progesterone. When 50% of the oocytes in each group reached GVBD, 10 oocytes were withdrawn, lysed, and assayed for ODC activity. GV represents an extract from uninjected and non-progesterone-treated oocytes. It can be concluded from this experiment that 50 to 100 ng xODC mo per oocyte can completely eliminate ODC translation during oocyte maturation. (D) Control oocytes (ctrl) or oocytes injected with ODC mo (100 ng per oocyte) were treated with progesterone and examined for GVBD at the indicated times after the addition of progesterone. (E) Uninjected oocytes (ctrl), oocytes injected with mODC mo, oocytes injected with xODC mo, and oocytes injected with AZ mo were treated with progesterone. At the indicated times, oocytes were examined for GVBD. Although only GVBD data for control oocytes are shown, none of the oligonucleotides affected the rate of GVBD, the percentage, or the time course (data not shown). At the indicated times, five oocytes were withdrawn from each group for ODC activity assays. On the right is an autoradiograph of a typical ODC assay. The graph shows the quantification of the same data.

