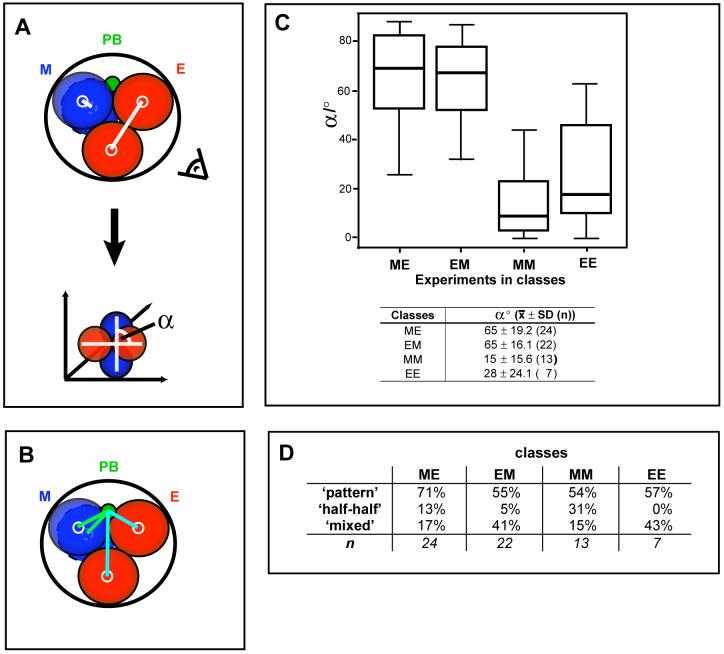
Fig. 4. The influence of the animal-vegetal axis on the generation of different blastocyst patterns.
(A)-(C) Classification of embryos according to sequence and orientation of second cleavage divisions. (A) To measure the angle (α) between the division planes of the 2-cell blastomeres (white lines), 3D representations were rotated to look at the angle (illustrated with the eye). (B) Scheme illustrating the measurement of the distance of cells to the polar body (PB, Methods). (C) Box-plot showing relationship between the four classes and α. The table shows average angles for each class (n=sample size). (D) Table showing the frequency of the different blastocyst patterns in each of the four embryo classes.

