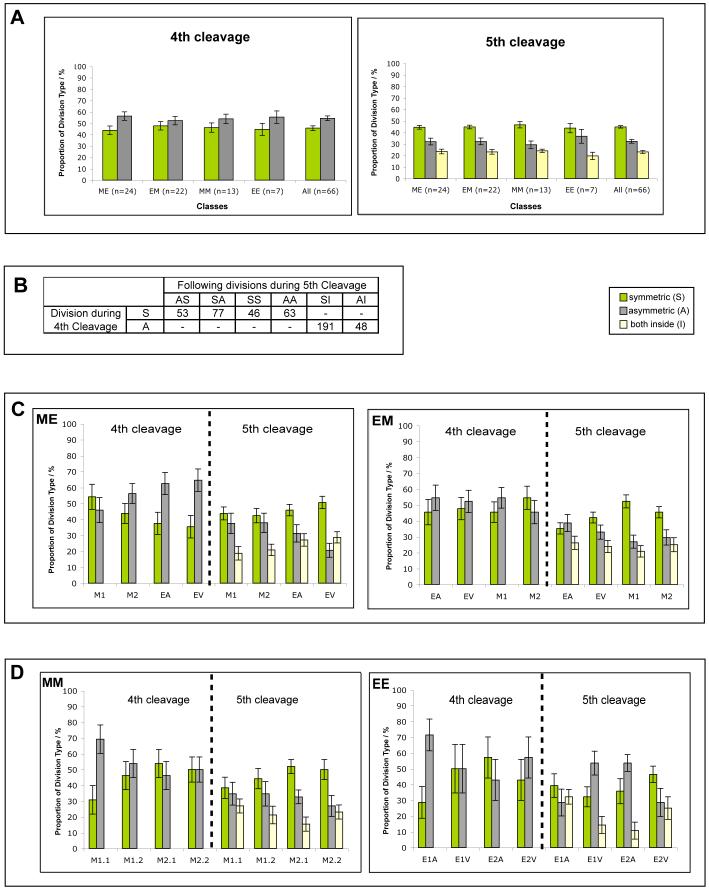
Fig. 5. Analysis of division orientation.
Analysis of division orientation at the 4th and 5th cleavage divisions. (A) Percentage of asymmetric and symmetric divisions in 4th and 5th cleavage (average ± SEM). (B) Analysis of cell division orientations of the two daughters of an asymmetric (A) or symmetric (S) division in the 4th cleavage round. The possible permutations (shown) differ significantly depending on the orientation of the 4th cleavage (χ2 test, p<0.001). ‘I’ denotes a division where both daughters lie inside the embryo. (C,D) Proportion of asymmetric/symmetric divisions of the 4-cell-stage descendants at 4th and 5th cleavage (average ± SEM) for the four classes. (C) ME and EM embryos, (D) MM and EE embryos. Each pair of columns represents the descendants of one of the 4-cell blastomeres (legend of Fig. 2 for abbreviations).

