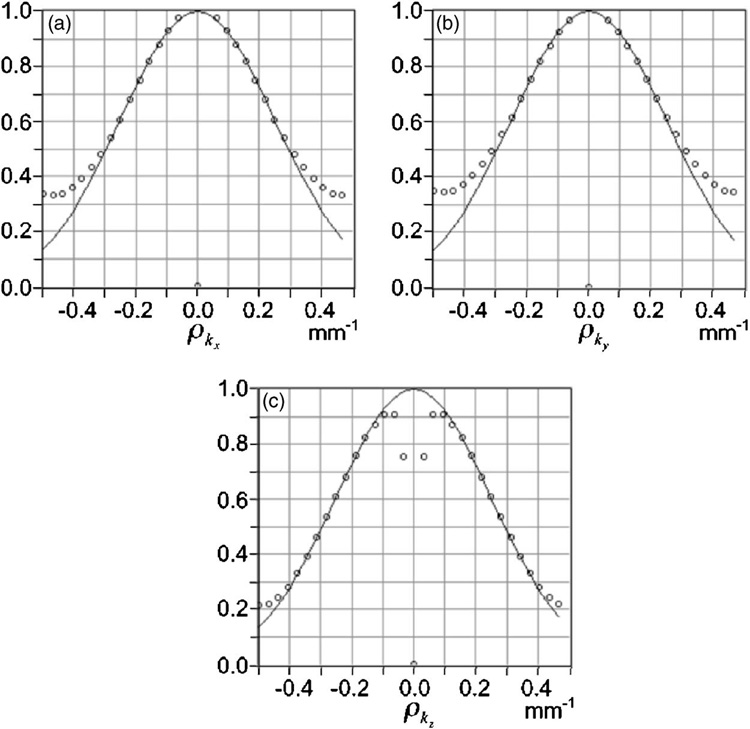
FIG. 3.
Normalized MTFeq of SemiSPECT along x (graph a), y (graph b), and z (graph c) axes, where the z axis is perpendicular to the circular slices of the cylindrical object space. On each graph, the dots represent the values of the MTFeq, and the line represents a Gaussian function closest to the MTFeq. The deviation from the Gaussian at high spatial frequencies is caused by using the discrete Fourier transform rather than the Fourier integral required in the definition.

