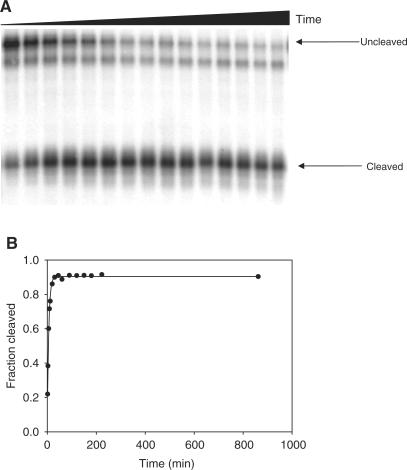
Figure 3.
Kinetic analysis of self-cleavage. (A) Representative autoradiographic image of denaturing PAGE 7% showing the fraction cleaved over a period of 900 min. (B) Graphical analysis of this particular run: kobs = (0.167 ± 0.007) min−1 (R2 > 0.99); error is standard deviation from the exponential fit. Reaction conditions: 1 mM EDTA, 200 mM NaCl, 50 mM cacodylate pH 7.4, 24°C. A slightly truncated species is observed and remains relatively constant throughout the time course suggesting the enzymatic production of minor, catalytically inactive species. Rate constants were calculated using equation (1) based on the relative autoradiographic densities in both the uncleaved and cleaved bands. Time points were 1, 3, 6, 9, 12, 20, 30, 45, 60, 90, 120, 150, 180, 240 and 900 min.

