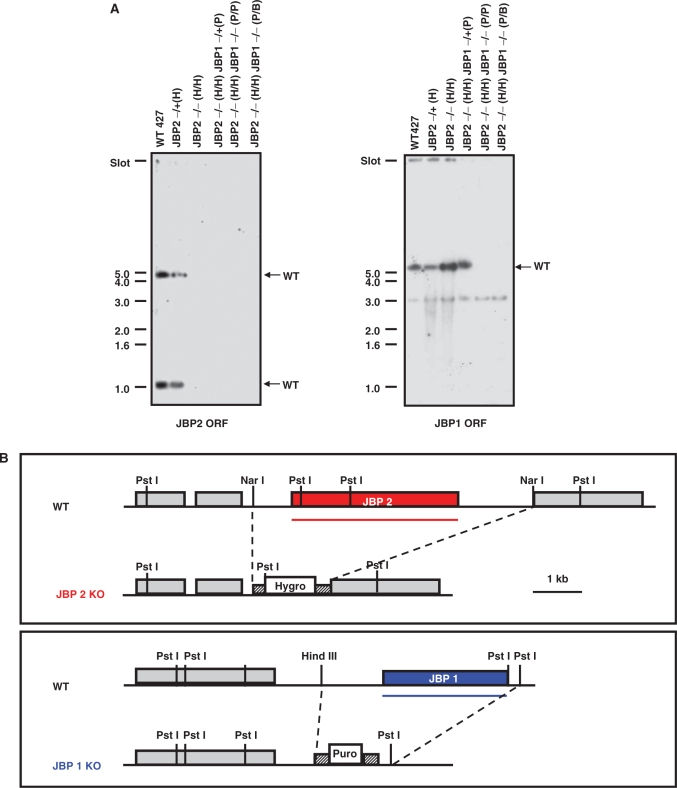
Figure 3.
Southern blot analysis reveals the deletion of both JBP1 and JBP2. (A) DNA was isolated from WT bloodstream cells (WT427), and cells from which either one (JBP2−/+(H)) or both (JBP2−/− (H/H)) alleles of JBP2 were deleted as previously described (9). JBP1 was then deleted from this cell line by by LOH (JBP2−/− (H/H)/JBP1−/− (P/P)) and by conventional methods (JBP2−/− (H/H)/JBP1−/− (P/B)). DNA samples were digested with PstI and probed for the presence of the JBP2 (left) or JBP1 (right) open reading frame (ORF). A clear loss of a band correlating with JBP2 and JBP1 is apparent in cell lines from which all four JBP alleles were deleted, regardless of the method of generation. The 1 kb DNA size marker is indicated on the left. The WT gene fragments are indicated by the arrows on the right. A cross-reactive 3 kb band is visible on the JBP1 ORF hybridization. H, P and B refer to the hygomycin, puromycin and blasticidin resistance genes, respectively. (B) Map demonstrating area of JBP1 or JBP2 targeted by deletion constructs. Pst I, HindIII, Nar I restriction sites are indicated. Puro, puromycin resistance gene; Hygro, hygromycin resistance gene. The ORF probes used in panel A are indicated by the lines.

