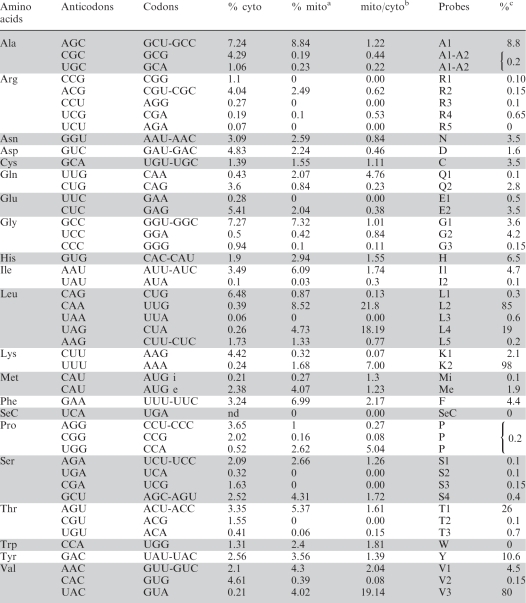
Table 1.
Steady-state levels of imported tRNAs in mitochondria relative to their abundance in the cytosol in Chlamydomonas reinhardtii
 |
Nuclear tRNA gene content (identified by anticodons), minimal potential codon recognition pattern (codons), cytosolic codon usage (% cyto) and name of probes are given as in (9), (see also supplementary data, Table S1 online).
aMitochondrial codon usage (% mito) is according to (6).
bRatio codon frequency (mito/cyto).
cThe steady-state levels of imported tRNAs relative to their abundance in the cytosol are given in percentage.
Mean values are given (see legend of Figure 3 for detailed explanations).
