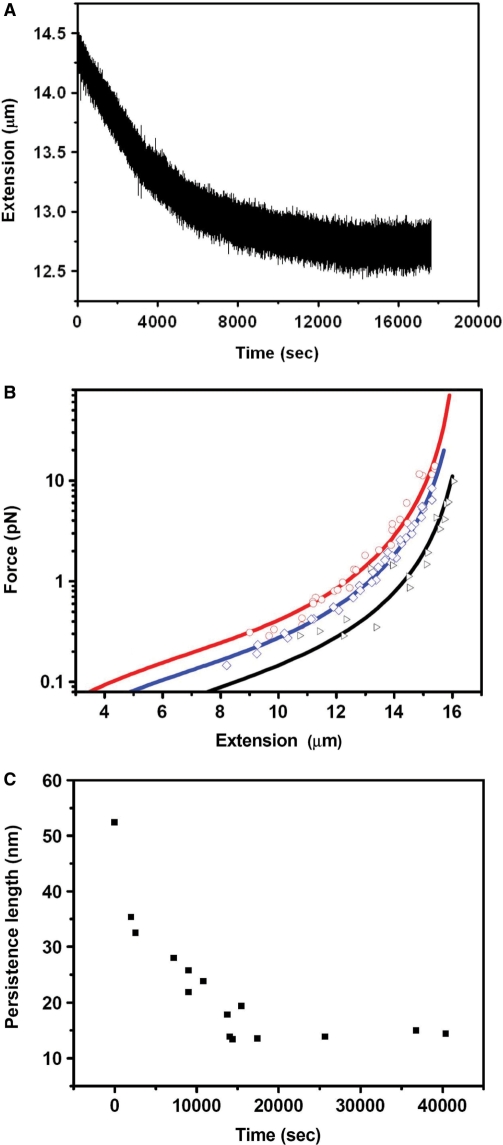
Figure 2.
Single-molecule experiments under low concentration of cisplatin. (A) After 77 μM cisplatin was added to the flow cell, the force exerted on DNA was adjusted to 1.3 pN, and the end to end distance was recorded in real-time. After about 4 h, DNA extension reaches a steady state. (B) The force versus extension curves for bare DNA (black), DNA treated by cisplatin of 77 μM (red) and 15.4 μM (blue) after the extension reached the steady states. The lines are the best fits of the data to Equation 1. (C) The change of persistence length with time when 77 μM cisplatin was added to DNA in the flow cell. Persistence length was obtained from fitting of the force versus extension curves to Equation 1 measured at the indicated times. After about 4 h, the persistence length reaches a steady state.

