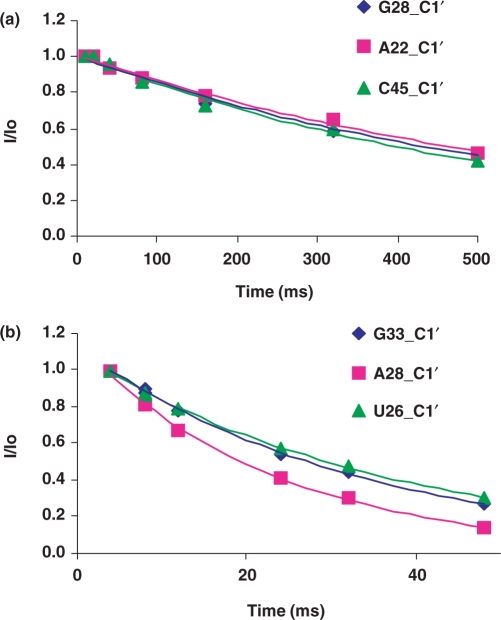
Figure 2.
Representative primary relaxation data for TAR RNA; normalized peak intensities are plotted as a function of relaxation delay time, τ, for 13C relaxation experiments carried out at 500 MHz on the Arg–TAR complex. (a) 13C T1; (b) 13C T1ρ; the curves through the data represents the best fit using the standard expression for mono-exponential decay.

