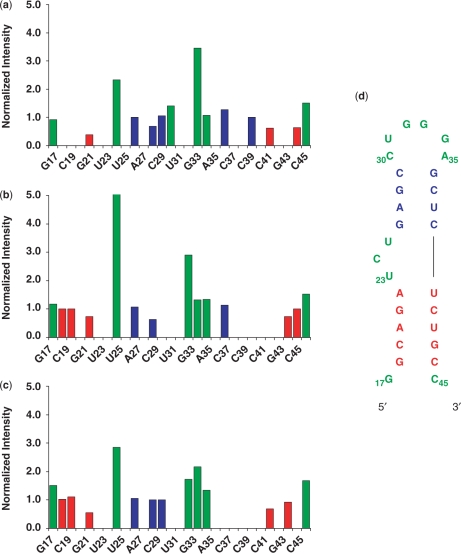
Figure 6.
The normalized peak intensities of cross-peaks in 13C–1H HSQC spectra versus sequence of the elongated TAR construct. Stem 1 of wt-TAR was elongated by 20 AU base pairs and two GC base pairs. The elongated stem is not shown; stem 1 is in red, stem 2 is blue and the loop, bulge and terminal ends experiencing local motions are in green: (a) TAR bases; (b) Tat-TAR bases; (c) cyclic peptide-TAR bases and (d) HIV-1 TAR RNA sequence.

