Figure 3.
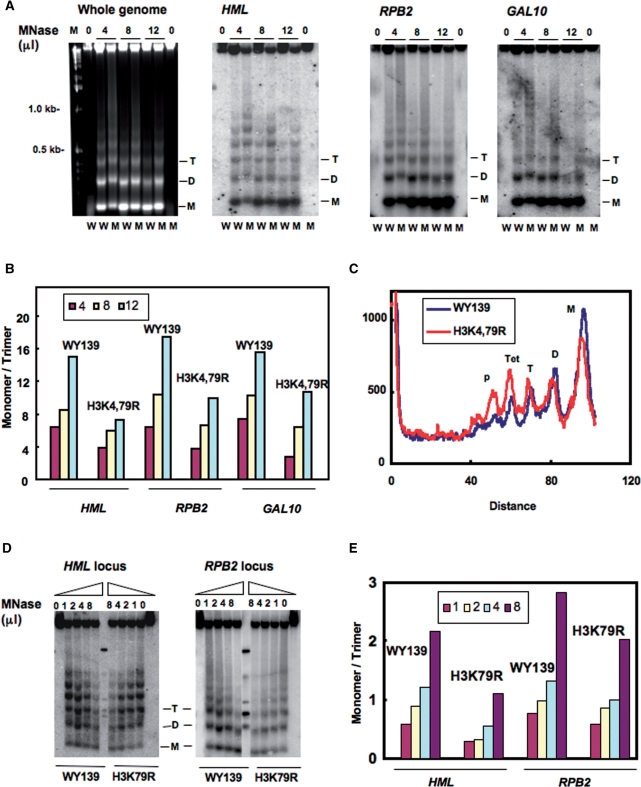
Nucleosome DNA is less accessible to MNase in H3 methylation mutants. Spheroplasts were isolated from WY139 (wt) and methylation mutants, treated with different concentrations of MNase (10 U/μl stock solution) and genomic DNA was isolated, electrophoresed on agarose gels, stained with ethidium bromide, blotted and hybridized with a probe specific for the HMLα1, RPB2 and GAL10 ORF. (A) MNase digestion patterns are shown for both bulk chromatin, HML, RPB2 and GAL10 chromatin. W: WY139 and M: H3K4,79R. (B) Quantitative analysis of MNase accessibility at the three loci. Data is expressed as the ratio of mono- to tri-nucleosome signal at different concentrations of MNase. (C) Comparative scans of the 4 μl MNase lanes for the HML locus in WY139 and mutant H3K4,79R cells. (D) MNase digestion patterns for HML and RPB2 chromatin of WY139 and H3K79R. (E) Quantitative analysis of MNase accessibility at HML and RPB2. Data is expressed as the ratio of mono- to tri-nucleosome formation at different concentration of MNase.

