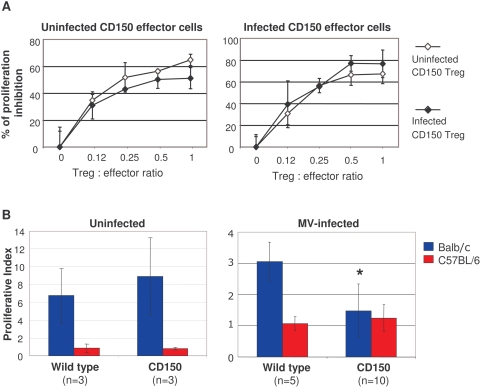
Figure 5. Characterization of Treg function following MV infection.
(A) Analysis of suppressor activity of Tregs isolated from CD150 mice, inoculated with MV (open symbol) or with medium (full symbol), in cocultures with CD4+CD25− effector T cells from either uninfected CD150 mice (left panel), or infected CD150 mice (right panel) in the presence of irradiated CD4+ T cell–depleted splenic APCs and Con A (3 to 5 pooled mice per group). Proliferation of Tregs from either control or CD150 infected mice in response to Con A was ∼300–600 cpm. The results are shown as the mean percentage of proliferation inhibition in triplicate cultures±SD. Results are representative of three different experiments. (B) Splenocytes isolated from either uninfected (left panel) or MV-infected (right panel) CD150 mice and their nontransgenic littermates (wild type) were stimulated with either irradiated Balb/c or C57Bl/6 splenocytes in MLR in triplicate cultures, as described in Methods. Proliferation is expressed as mean proliferation index±SD and is representative from two independent experiments (* P<0,01, Student t-test).

