Figure 9.
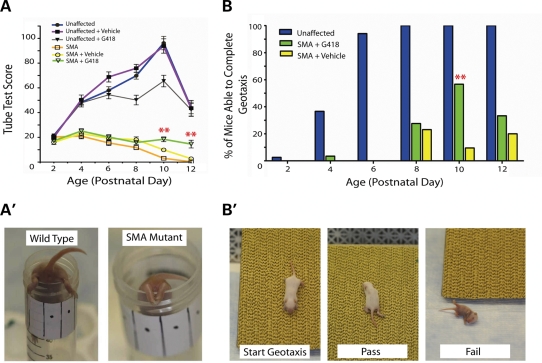
G418 treatment increases motor function of SMA mutant mice. (A) Graph of tube test score (TTS). Groups of untreated, vehicle-injected and G418-treated mice were administered the tube test from PND2-12. Treatment groups consisted of 29 G418-treated SMA mice, 35 G418-treated unaffected mice, 34 vehicle-injected unaffected mice and 20 vehicle-injected SMA mice. Values represent the mean ± SEM. (**P ≤ 0.01, Student's t-test) (A′) Photograph of mice performing the tube test at PND10. (B) Graph of the percentage of mice able to complete a negative geotaxis assay at each age. (**P ≤ 0.01, χ2.) (B′) Photographs illustrating the negative geotaxis assay.

