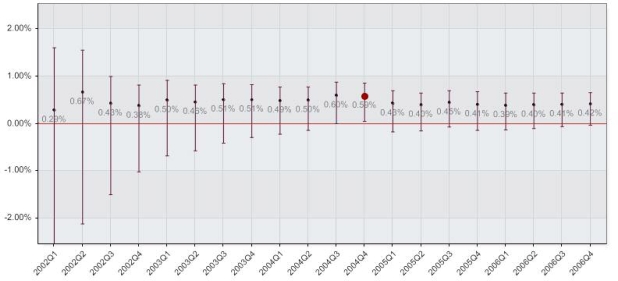
Figure 1.
Results by calendar quarter between the use of a vascular closure device and manual compression in the unadjusted patient procedure cohort. The figure shows the cumulative proportional difference point estimate with 95% confidence intervals, with significant differences between the groups highlighted by the enlarged red dots.

