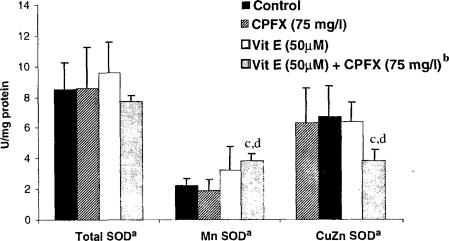
Figure 5.
The effect of CPFX and vitamin E on total CuZn, and Mn SOD levels in normal human fibroblast cells. aThe results were presented as mean ± SD (n = 3). Statistical comparisons were made using the Mann–Whitney U-test. bThe cells were preincubated with 50 μM Vitamin E (4 h) and afterward exposed to 75 mg/l of CPFX for 48 h. c p < 0.05 vs. control; d p < 0.05 vs. CPFX.

