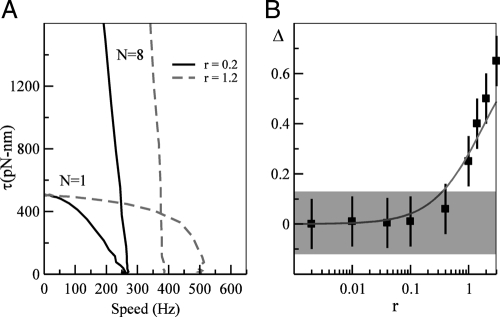
Fig. 4.
Dependence of the maximum speed at zero load on N as a function of r ≡ k+/k−. (A) Torque-speed curves for r = 0.2 (solid lines) and r = 1.2 (dotted lines) are shown for N = 1 and N = 8. We change r by varying k+ and keeping k− constant. For r = 0.2, the maximum velocities ωmax(1) and ωmax(8) at zero load are roughly the same, but they differ significantly for r = 1.2. (B) The dependence of Δ = 2(ωmax(1) − ωmax(8))/(ωmax(1) + ω max(8)) on r. The line represents our analytical predictions from Eq. 5. The shaded region shows the ∼12% experimental error.

