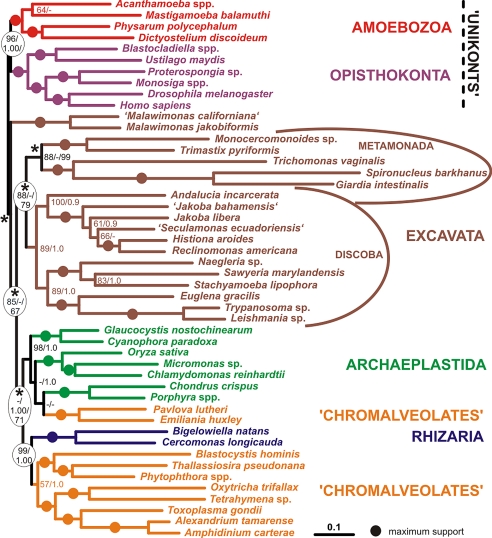
Fig. 1.
The phylogenetic tree estimated from the main dataset. This topology received the highest likelihood in the exhaustive search of unconstrained nodes using the WAG+ Γ model; branch-lengths were calculated in RAxML using the WAG+ Γ model. The representatives of the 6 supergroups are color-coded. Asterisks indicate the nodes that were not constrained during the exhaustive search. The numbers at the nodes indicate bootstrap support calculated by RAxML bootstrapping/PhyloBayes posterior probability. At nodes that were not constrained during the exhaustive search in the separate analysis (asterisks), the third number indicates the RELL bootstrap value. Branches that received maximum possible support by all methods are indicated by full circles. Dashes indicate bootstrap values <50%, or posterior probabilities <0.5. Although the analyses did not assume a root, the tree is displayed with the basal split between “unikonts” and bikonts as suggested in ref. 37.

