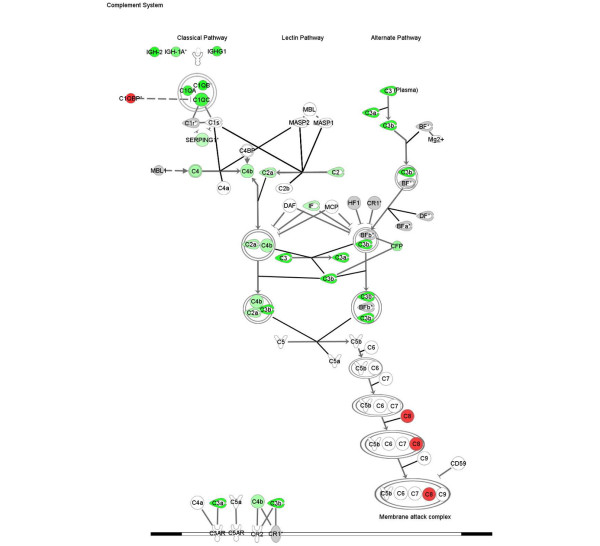
Figure 9.
Complement pathway altered in disease. Expression of components of the complement pathway in nephritis compared with asymptomatic tissue. Green colour indicated increased expression and red colour indicates a decreased expression in nephritis tissue. Grey colour indicates that the fold change and FDR p < 0.05 or the sigPathway FDR p < 0.05 filters were not met. The names of the genes are in "nodes". The shape of the nodes is related to gene function/family membership. The lines between the nodes represent the connectivity between genes. Solid lines indicate direct protein-protein interactions. Dotted lines represent indirect interactions.

