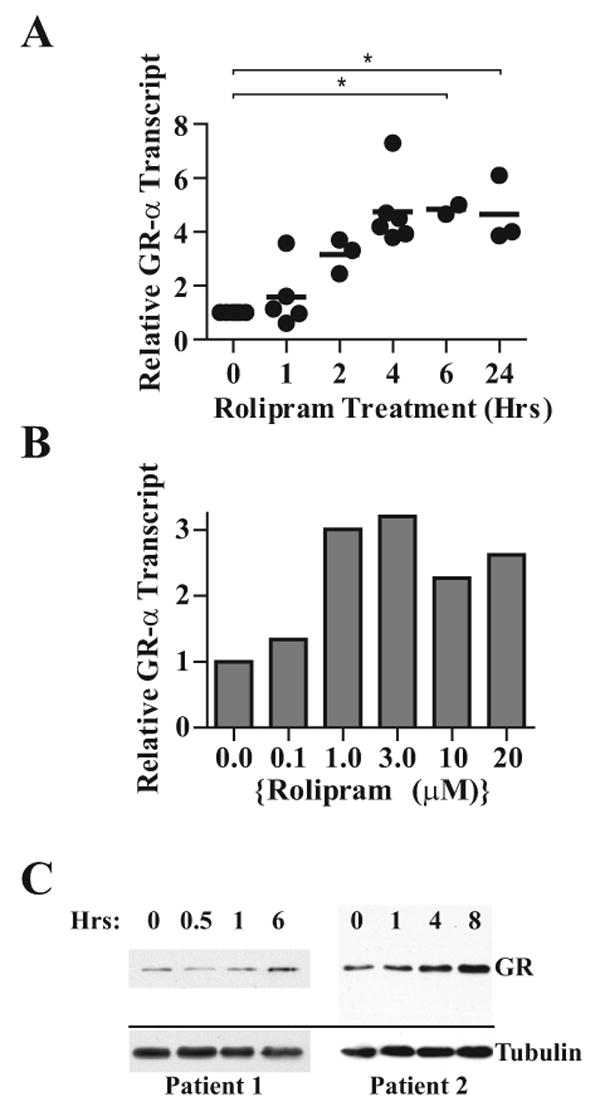
Figure 1. GRα expression is up-regulated in B-CLL cells following treatment with the PDE4 inhibitor rolipram.

(A) B-CLL cells were treated for the indicated lengths of time with rolipram (20 μM), followed by RNA isolation, cDNA synthesis and real-time PCR for GRα using oligonucleotides that spanned exons 8 and 9α. Each point represents the fold increase in GRα transcript levels of an individual patient sample relative to the same patient's CLL cells treated with vehicle (DMSO) alone. The mean fold increase in transcript level is denoted with a horizontal line. Asterisks denote significant main effect for time at P < 0.05 (ANOVA). (B) B-CLL cells from an individual patient were treated for four hours with DMSO or rolipram at the indicated dosage (μM), followed by RNA isolation and real-time RT-PCR for GRα transcript levels relative to vehicle (DMSO) control. The data are representative of one of two similar experiments. (C) B-CLL cells were treated with DMSO alone (0 hr time point) or rolipram (20 μM) for the indicated amount of time, followed by lysis, protein quantification and immunoblot analysis for GRα protein expression (GR). Alpha-tubulin was also assessed by immunoblot analysis as an internal loading control. Results from two patients are shown and are representative of four patients tested.
