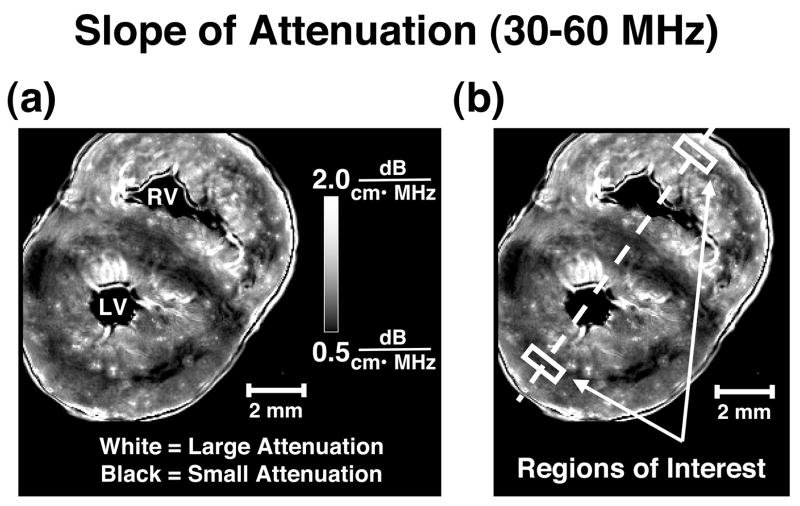
Figure 3.
(a) Representative slope of attenuation image of a fetal pig heart with bright pixels representing relatively large values for slope of attenuation and dark pixels representing small values for slope of attenuation (range 0.5 to 2.0 dB/(cm•MHz)). LV=left ventricle; RV=right ventricle (b) An illustration of the bisecting line used for line profile analysis and locations of the regions of interest in a representative slope of attenuation image.

