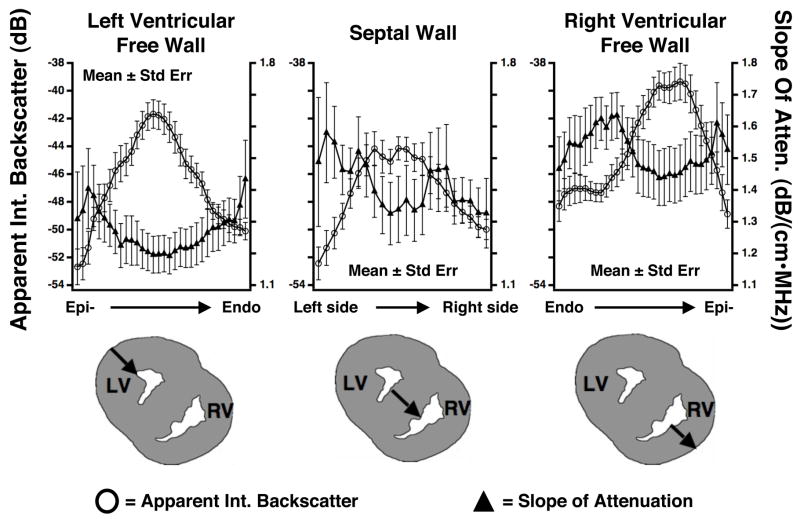
Figure 6.
Mean (± SE) values of the apparent integrated backscatter (IBS) and slope of attenuation coefficient with respect to position within the left ventricular free wall, septal wall, and right ventricular free wall for 15 fetal pig heart specimens. The open circles represent average apparent integrated backscatter values and correspond to the left axes. The average slope of attenuation coefficient values are plotted using triangles and correspond to the right axes. Below the graphs are illustrations of the locations of the line profiles within the walls of the fetal pig hearts. LV=left ventricle; RV=right ventricle

