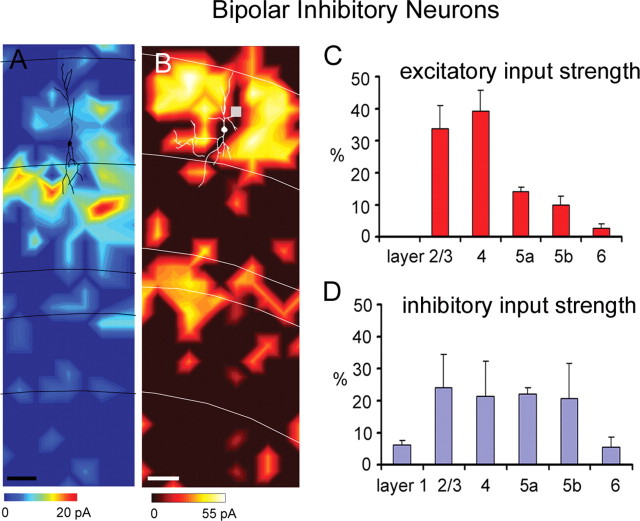
Figure 6.
Laminar patterns of excitatory and inhibitory input to bipolar cells. A, Excitatory input map from a bipolar cell, while B shows an inhibitory input map from another bipolar cell (for morphological and electrophysiological features of the bipolar cell illustrated in A, see supplemental Fig. S2J–L, available at www.jneurosci.org as supplemental material). C, Average laminar strength for excitatory input from the bipolar cells, and D shows their average inhibitory input strength. Conventions are as in previous figures.

