
Figure 7.
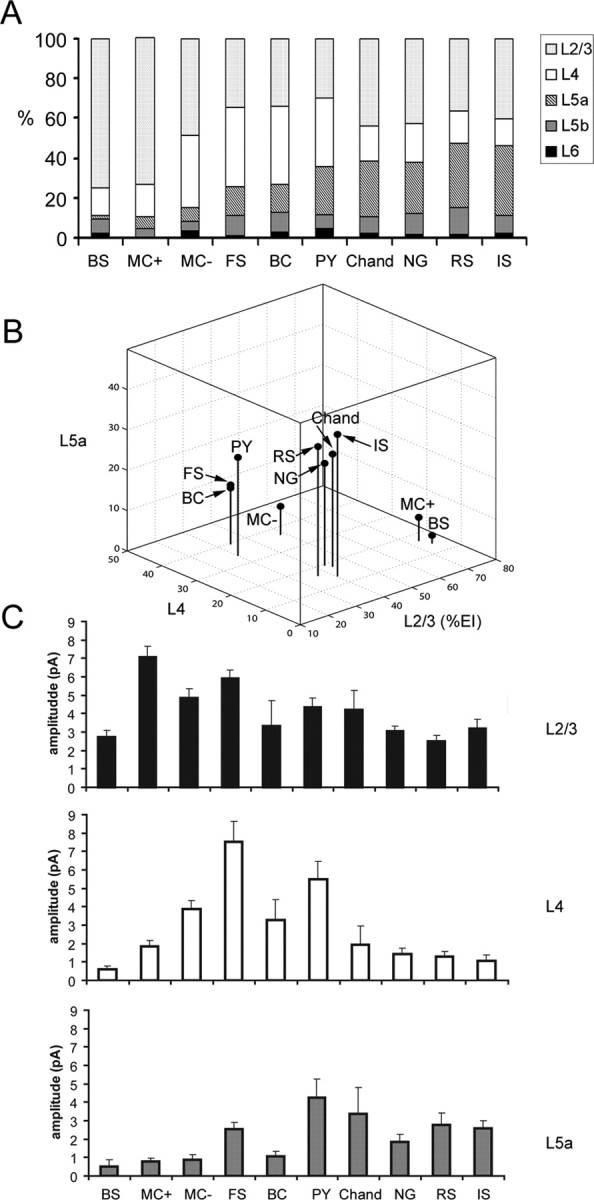
Summary of excitatory input patterns across all the cell types examined. A, A series of cumulative histograms with average percentages of excitatory input (%EI) from all the layers examined (layers 2/3, 4, 5a, 5b, and 6) for all the cell types examined: BS cells, SOM+/CR+ Martinotti cells (MC+), SOM+/CR− Martinotti cells (MC−), FS basket cells, BC, pyramidal cells (PY), chandelier cells (Chand), neurogliaform cells (NG), RS cells, and IS cells. B, A three-dimensional plot that shows average excitatory %EIs of layers 2/3, 4, and 5a for the cell types examined. C, Average excitatory EI amplitudes from layers 2/3, 4, and 5a for the cell types examined. Bars represent mean ± SE.