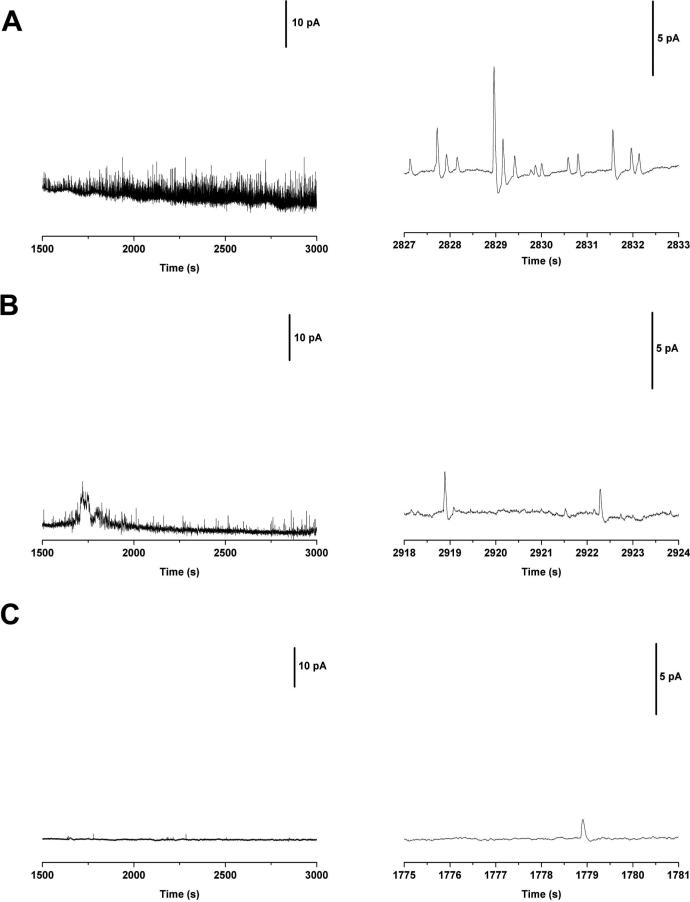
Figure 4.
Representative electropherograms for the end-column lysis and detection of liposomes. Liposomes injected for 20 s at 111 V/cm and run at 333 V/cm. Individual peaks are shown in the expanded view to the right. (A) Liposomes loaded with 150 mM DA. (B) A ten-fold dilution of the liposome suspension injected in part A. (C) Electropherogram of control liposomes that were loaded with buffer only (no DA).

