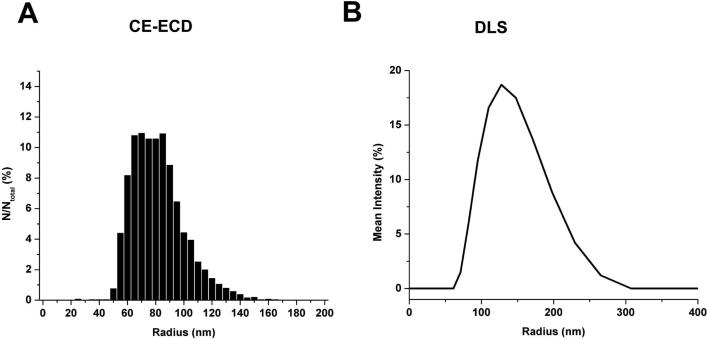
Figure 5.
Plot of the normalized frequency histogram describing the radius size distribution based on the internalized volume of dopamine detected from (A) CE-ECD and (B) DLS experiments for liposomes loaded with 150 mM DA. Average radii and standard deviation listed in Table 2.

